
Out of Memory (OOM) Error
Out of memory error is very common error when you are developing for a application that deals with multiple images sets or large bitmaps or some Animation stuff. In this case we have to be very careful and efficient while handling the images or object allocation and deallocation. OOM error comes when the allocation crosses the heap limit or your process demand a amount of memory that crosses the heap limit.
In Android, every application runs in a Linux Process. Each Linux Process has a Virtual Machine (Dalvik Virtual Machine) running inside it. There is a limit on the memory a process can demand and it is different for different devices and also differs for phones and tablets. When some process demands a higher memory than its limit it causes a error i.e Out of memory error.
Possible Reasons:
There are number of reasons why we get a Out of memory errors. Some of those are:
1. You are doing some operation that continuously demands a lot of memory and at some point it goes beyond the max heap memory limit of a process.
2. You are leaking some memory i.e you didn’t make the previous objects you allocated eligible for Garbage Collection (GC). This is called Memory leak.
3. You are dealing with large bitmaps and loading all of them at run time. You have to deal very carefully with large bitmaps by loading the size that you need not the whole bitmap at once and then do scaling.
The biggest reason for Out of memory is a Memory leak. First lets see a memory leak examples:
Examples:
1. We make an Activity and create a TextView with Activity context and set a sample text in to it.
@Override
 protected void onCreate(Bundle state) {
   super.onCreate(state);
   TextView label = new TextView(this);
   label.setText("Leaks are bad");
   setContentView(label);
 }
This means that views have a reference to the entire Activity and therefore to anything your activity is holding onto; usually the entire View hierarchy and all its resources. Therefore, if you leak the Context (“leak” meaning you keep a reference to it thus preventing the GC from collecting it), you leak a lot of memory. Leaking an entire activity can be really easy if you are not careful.
2. When the screen orientation changes the system will, by default, destroy the current activity and create a new one while preserving its state. In doing so, Android will reload the Application’s UI from the resources. Now imagine you wrote an application with a large bitmap that you don’t want to load on every rotation. The easiest way to keep it around and not having to reload it on every rotation is to keep in a static field:
private static Drawable sBackground;
@Override
protected void onCreate(Bundle state) {
 super.onCreate(state);
 ImageView label = new ImageView(this);
 if (sBackground == null) {
   sBackground = getDrawable(R.drawable.large_bitmap);
 }

 label.setBackgroundDrawable(sBackground);
 setContentView(label);
}
This code is very fast and also very wrong; it leaks the first activity created upon the first screen orientation change. When a Drawable is attached to a view, the view is set as a callback on the drawable. In the code snippet above, this means the drawable has a reference to the ImageView which itself has a reference to the activity (the Context) which in turns has references to pretty much anything (depending on your code.).
Now if the orientation changes the Drawable will not come under GC because it is static and due to this the ImageView will also not go under GC operation because the Drawable is linked to the ImageView by the Drawable callback and same for Activity context because ImageView was created with Activity context. So this lead to a memory leak and every time you change the orientation this leak will grow in the heap and at some point it will increase the heap limit and android will kill the application and throw Out of memory error.
Tools to Diagnose OOM
In Android there are some tools that can be used to find the memory leaks and one of them is MAT (Memory Analyzer Tool). This can be used as a plugin to Eclipse or as a stand alone tool.
Lets start with installing MAT and using it with Eclipse with a step by step guide:
1. To start up with this tool you have to download this tool from following link: http://www.eclipse.org/mat/downloads.php
2. Start Eclipse and run your application.
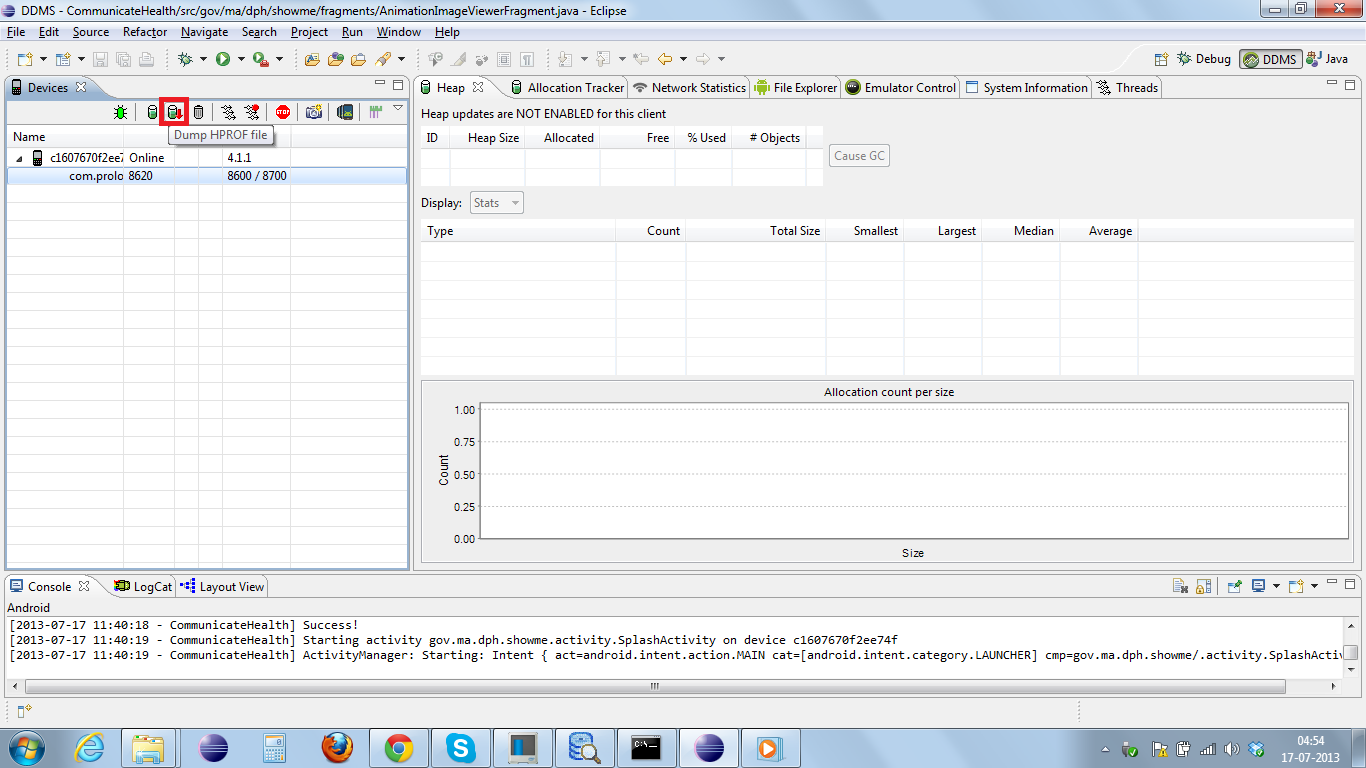
3. Go to DDMS and select your application and click the Dump HPROF file button and it will ask you to save the hprof file. Save it on your hard disk.
4. Run the MemoryAnalyzer.exe file situated in the MAT package downloaded.
5. This MAT tool will not understand the hprof file generated by Eclipse so you have to convert it using the hprof-conv tool in the tools folder of android-sdk using the following command:
hprof-conv com.example.android.hcgallery.hprof mat.hprof
6. Now this file is ready to use with MAT.
How to analyse the Heap dump in MAT ?
Case Study
While doing Android app development, I got Out of memory error. In the following example I will share my problem statement and the way i found the leak and how i resolve it.
Problem Statement:
I was dealing with multiple Drawables that are used in AnimationFragment class to do a frame animation and it was working fine as long as I didn’t check the heap while rotating the device. Every time I was rotating the device the Activity restarts as to load a new layout for landscape mode and than heap grows and this keep on going and then I fall in to OOM error.
Reason:
Actually there was a context leak in my Fragment and every time I rotate the device the previous Context is not destroyed because the Drawable used in the AnimaitonDrawable class were still holding a callback to the AnimationDrawable that in turn stops the Activity to get destroyed or to get collected by the GC.
How I found the reason?
1. I took a dump for my application and convert it using hprof-conv and then open the file “mat.hprof” in MAT.
2. Go to overview option and check the Top consumer option and it will look like following:
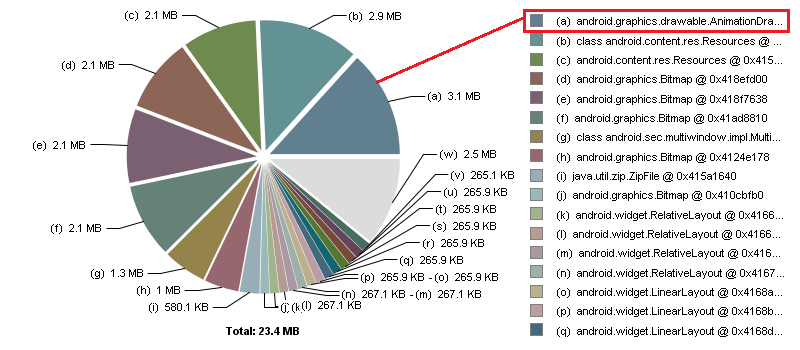
This diagram will tell you about the allocation and the space occupied by every object (widget, drawables, bitmaps etc). Using this you can check which objects are taking more memory than you can look at the code and attack them first. In my case it was AnimatioinDrawable.
There are two heap shown in the diagram lets see them first:
Shallow heap: This is the size in bytes that is actually taken by the variable.
Retained heap: This is the size of the variables with whom this variable is maintaining reference.
To get it better see the following image

For A the shallow heap is 100 but the Retained heap is 300 because it is holding 300 bytes of memory to be collected by GC.
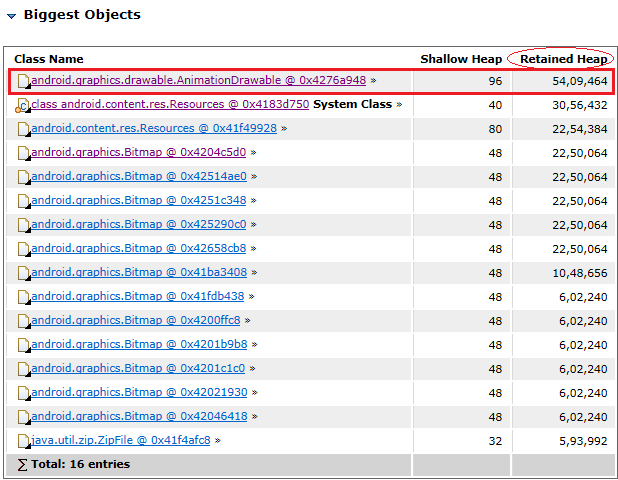
In the 2nd image we can clearly see that the AnimationDrawable objects are the biggest objects in the heap. So we should target AnimationDrawable first. To see the actual object and its location click on the respective row and go to ListObjects -> with incoming reference and then you will see the following window.
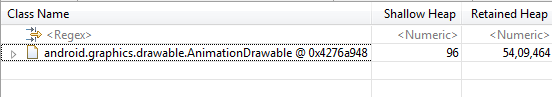
Expand this entry to see all the objects and in this case the entries are
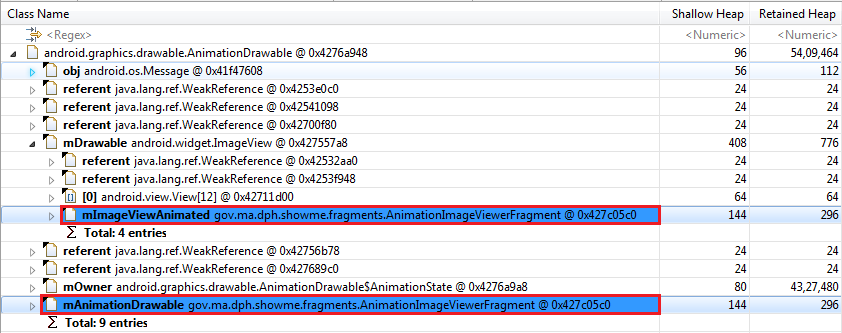
Retained Heap is more important for finding leaks, as it is the total size of all objects being kept alive by this dominator. To get this number, MAT needs to calculate the Retained Size by following all object references. As sorting by Retained Heap is very helpful for finding leaks, MAT displays the largest retained heaps in a pie chart.
The selected ones are the objects in my code which are having high retained heap value and the entries are shown with package name and class name. Now you exactly know where are the objects that are taking the most of memory and you can recheck that code.
Solution:
I checked my code by using the MAT reference and then I realize this AnimationDrawable is not getting destroyed and because of this the frames in it are also becoming a part of the leak. So, i clear all the callbacks of AnimationDrawable as soon as the Fragment is destroyed and after this heap was stable and when orientation changes the heap decreases as the Drawables got destroyed and than increases for the new allocation.
There can be a no. of reasons for a OOM but the main reasons mostly ends in a Leak. So if get closer to the leaks than you can easily get rid of OOM.
Getting a Heap dump at runtime:
When you are getting a OOM error and you want to check the heap and allocation when the error comes than you can add some code that will catch OOM error and than calling the Debugger to dump the Heap from our code. Lemme show you a example to do this:
1. Make a OOM error Listner as a inner class that will implement Thread.UncaughtExceptionHandler
public class MyActivity extends Activity {
 public static class MyUncaughtExceptionHandler implements Thread.UncaughtExceptionHandler {
 @Override
 public void uncaughtException(Thread thread, Throwable ex) {
 if(ex.getClass().equals(OutOfMemoryError.class))
 {
 try {
   android.os.Debug.dumpHprofData("/sdcard/dump.hprof");
 }
 catch (IOException e) {
   e.printStackTrace();
 }
 }
 ex.printStackTrace();
 }
 }
2. In your Activity’s onCreate set a listener on the current thread that will catch the OOM error
@Override
 public void onCreate(Bundle savedInstanceState) {
 super.onCreate(savedInstanceState);

Thread.currentThread().setDefaultUncaughtExceptionHandler(new MyUncaughtExceptionHandler());
}
}
In this way you can check the heap dump at the point when OOM occurs.
Best practices to avoid memory leaks or OOM
- Do not keep long-lived references to a Context / Activity (a reference to an Activity should have the same life cycle as the activity itself)
- Try using the context of application instead of a context of activity
- If you are using a large bitmap as background or something in your application than don’t pull the full image in to the main memory. You can use the insample size property of bitmap to bring the size your screen needs.
- Memory fragmentation: You should plan the allocation of the variables so that after deallocation the memory should not be scattered or fragmented. If 10 MB memory is available in chunks and process requests for 2 MB and couldn’t find a chunk of 2 MB then it will ask for more heap and this in turn can cause OOM.
- Sending large files to server should be done in chunks because loading a large image in bytes can cause OOM.
- A activity that is using so many images should remove the callbacks to the drawable used by calling setCallBack(null) on the drawable to avoid OOM.
For building world-class Android solutions, contact sales@innovationm.com